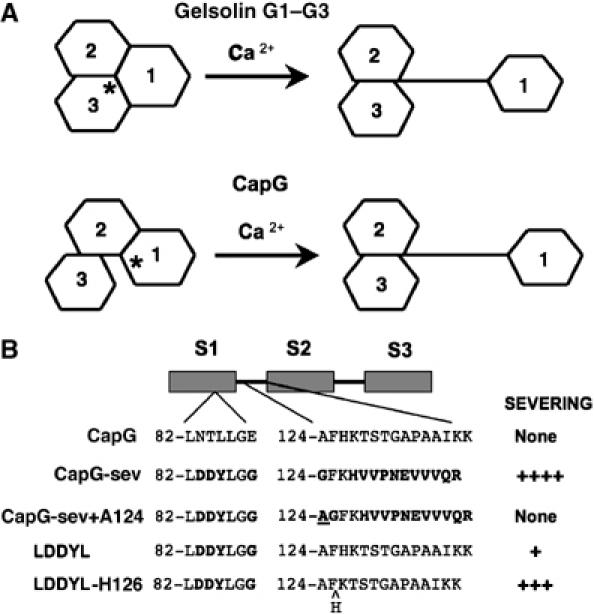
Figure 6.

Models for calcium activation of gelsolin and CapG, and a summary of CapG severing mutants. (A) Cartoon comparing the proposed models for gelsolin G1–G3 and CapG Ca2+ activation. In the inactive conformation, the area of interface between S1 and S3 in CapG is smaller, as compared to the gelsolin; while the S1–S2 and G1–G2 areas of interface are similar. In functional terms, CapG has an S1–S2 latch while gelsolin has a G1–G3 latch. The asterisk denotes the site where Ca2+ first binds to initiate unfolding (S1 for CapG and G3 for gelsolin). Note that in the active conformation the arm linking S1 to S2 in CapG is longer than for gelsolin, and this greater length impairs actin filament severing. The gelsolin model is based on Burtnick et al (2004). (B) Schematic depictions of the recombinant mutant CapG proteins summarizing their relative actin filament severing activity. Mutations were only made in S1 and in the S1–S2 linker. The specific amino acids modified are depicted for each mutant. Bold letters indicate the amino acids that were changed. The alanine added to the S1–S2 linker of CapG-sev is underlined, and the histidine deleted in the LDDYL mutant S1–S2 linker is indicated by a ^. Severing activity was roughly quantified as none or by plus signs. None=no severing up to a final concentration of ⩾4 μM, +=significant severing at 1–2 μM, +++=significant severing at 100–300 nM and ++++=significant severing at 30–50 nM.
