
Figure 3.
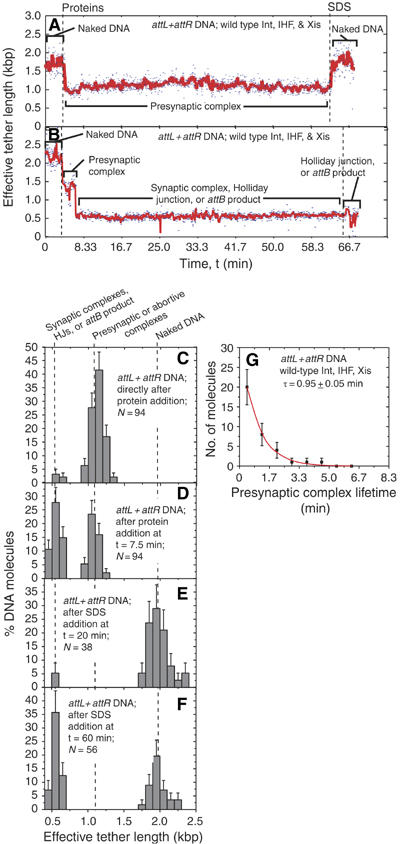
Complex formation and recombination of single attL+attR-containing molecules. (A, B) Changes in the effective lengths of single attL+attR DNA molecules in response to the addition of recombination proteins Int, Xis, and IHF. (A) Example of a molecule that failed to synapse within the duration of observation. (B) Example of a molecule that synapsed and went on to recombine. The three proteins or the SDS challenge were added at the times indicated by dashed lines. (C–F) Distributions (±s.e.) of effective tether lengths of attL+attR molecules. In (D), t=7.5 min is used because no additional synaptic complexes form after that time. In (E) and (F), the measurement was immediately preceded by addition of SDS at t=20 or 60 min, respectively. (G) Distribution of presynaptic complex lifetimes for attL+attR molecules that went on to form recombinant product. The lifetime τ was determined by fitting with a scaled exponential probability function (see Materials and methods) and is the inverse of the synapsis rate constant.