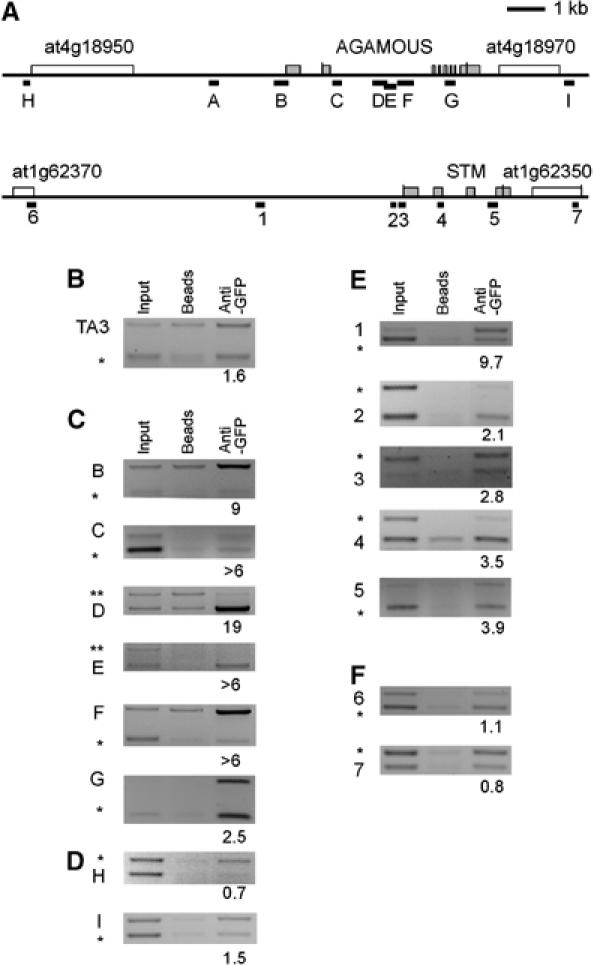
Figure 4.

CLF is bound to AG and STM. (A) Schematic structure of the AG and STM loci including the 5′- and 3′-flanking genes. For AG and STM, the exon/intron structure (exons are shaded), and for the flanking genes, the transcribed regions are depicted. Black bars with letters (for AG) or numbers (for STM) indicate regions amplified in ChIP PCRs. (B, C) IP on chromatin preparations isolated from 10-day-old seedlings of a 35S∷GFP-CLF transgenic line was performed without antibody (‘beads') or anti-GFP antibodies and precipitated DNA was amplified by PCR. Semiquantitative ChIP duplex PCRs were used to amplify ACTIN 2/7 (marked with *) or PHOSPHOFRUCTOKINASE (PFK) sequences (marked with **) as internal controls and regions from TA3 retrotransposon (B) as negative control, from AG (C) and AG flanking genes (D), or from STM (E) and STM flanking genes (F). Numbers below the lanes indicate the ratio of the intensity of TA3, AG or STM products, respectively, compared to ACTIN or PFK intensity after IP normalised to the ratio before IP (‘input'). Each experiment was performed at least twice; representative experiment is shown.
