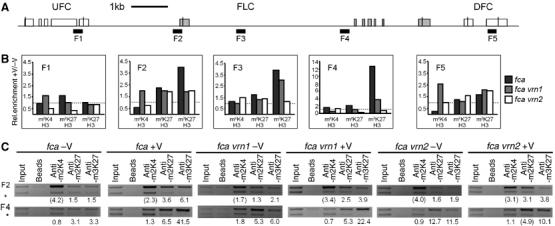
Figure 6.

The entire FLC locus shows strong enrichment with H3K27me3 after vernalisation. (A) Schematic structure of the FLC locus including the flanking genes UFC and DFC. The FLC exons are shaded. Black bars indicate the regions amplified. (B) Summary of ChIP PCRs performed with antibodies against H3K4me2, H3K27me2 and H3K27me3 on chromatin extracted from the vernalisation-requiring background fca, vrn1 fca and vrn2 fca mutants before and after vernalisation. Plants were grown for either 2 days at 4°C (−V) or 40 days at 4°C (+V), then transferred to 22°C and harvested after 15 days. Relative enrichment for ChIPs was determined as described in Figure 4 and the ratio of +V/−V for each genotype and antibody was calculated. Dashed lines indicate relative enrichment of 1. (C) Example of ChIPs performed for the different genotypes, antibodies and growth conditions. The whole data set is available in Supplementary Figure S4.
