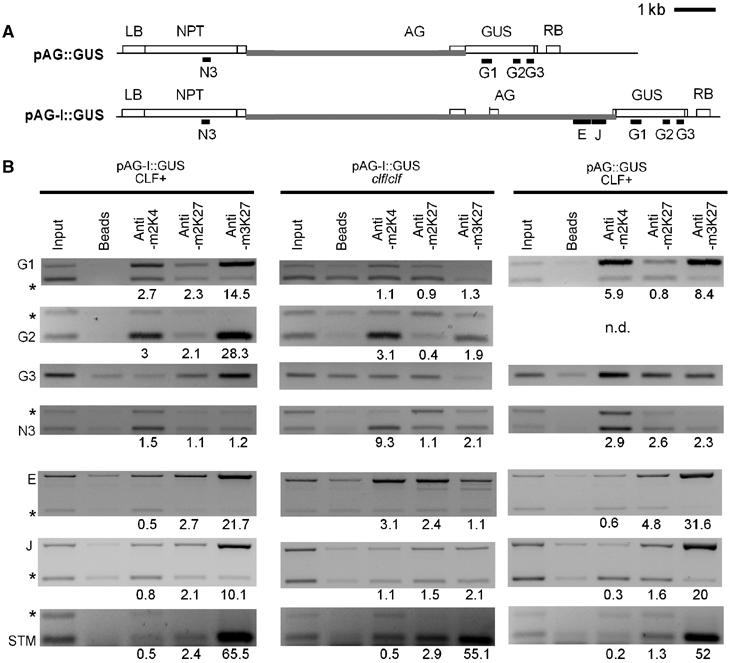
Figure 7.

H3K27me3 spreads over AG transgenic sequences but is not sufficient for silencing. (A) Schematic structure of the pAG∷GUS and pAG-I∷GUS transgenes, constructed by Sieburth and Meyerowitz (1997). Black bars indicate regions amplified in ChIP PCRs. Grey bars indicate sequences homologous to AG. The pAG∷GUS T-DNA contains a NEOMYCIN PHOSPHOTRANSFERASE (NPT) resistance gene close to the left border (LB) of the T-DNA, around 6 kb of AG upstream region, the first AG exon, the β-GLUCURONIDASE (GUS) coding region and the right border (RB) of the T-DNA. The pAG-I∷GUS T-DNA consists of the same T-DNA backbone and AG upstream region but contains the first two exons and the first two introns of AG. The pAG-I∷GUS reporter reflects the endogenous AG expression pattern in wild-type and clf leaves, whereas pAG∷GUS is strongly mis-expressed in wild-type cotyledons and leaves (Sieburth and Meyerowitz, 1997). (B) Results of ChIP PCRs performed on IP with antibodies against H3K4me2, H3K27me2 and H3K27me3 on chromatin samples extracted from 10-day-old wild-type or clf seedlings carrying the pAG-I∷GUS transgene or wild-type seedlings carrying the pAG∷GUS transgene. Regions F and J of AG are present both at the endogenous AG locus and on the pAG-I∷GUS transgene. A region of STM (region 2 in Figure 4) served as an H3K27me3 control. Relative enrichment for ChIPs was determined as described in Figure 4.
