
Figure 3.
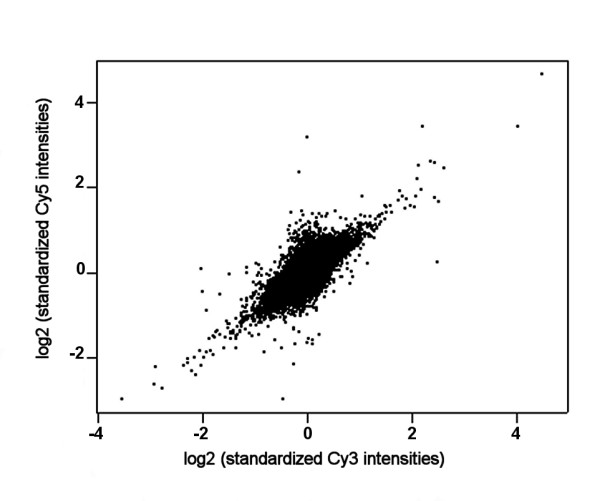
Scatterplot of the standardized Cy5 signal intensities against the standardized Cy3 signal intensities of all arrays.
Official websites use .gov
A
.gov website belongs to an official
government organization in the United States.
Secure .gov websites use HTTPS
A lock (
) or https:// means you've safely
connected to the .gov website. Share sensitive
information only on official, secure websites.
Scatterplot of the standardized Cy5 signal intensities against the standardized Cy3 signal intensities of all arrays.