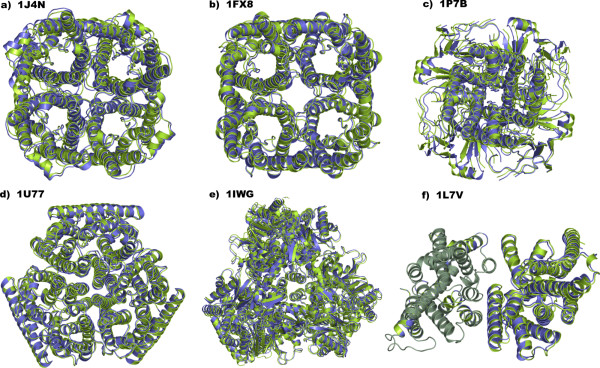
Figure 10.
Superimposition between native (green color) and the best native-like (violet color) oligomeric structures of: (a) AQP1 (PDB code: 1J4N; Cα-RMSD = 1.31 Å; best predicted tetramer: A-Bs2-Cs1-Ds1), (b) GlpF (PDB code: 1FX8; Cα-RMSD = 1.11 Å; best predicted tetramer: A-Bs2-Cs1-Ds1), (c) KirBac1 (PDB code: 1P7B; Cα-RMSD = 1.47 Å; best predicted tetramer: A-Bs3-Cs1-Ds3), (d) AmtB (PDB code: 1U77; Cα-RMSD = 0.75 Å; best predicted trimer: A-Bs1-Cs1), (e) AcrB (PDB code: 1IGW; Cα-RMSD = 1.56 Å; best predicted trimer: A-Bs4-Cs1), and (f) BtuCD (PDB code: 1L7V; Cα-RMSD = 0.63 Å). For BtuCD, the native-like structure shown in this figure, i.e. the A-Bs1678 dimer, has been achieved through a dipole moment-based reorientation approach. The oligomers are seen from the extracellular side in a direction perpendicular to the putative membrane surface.

