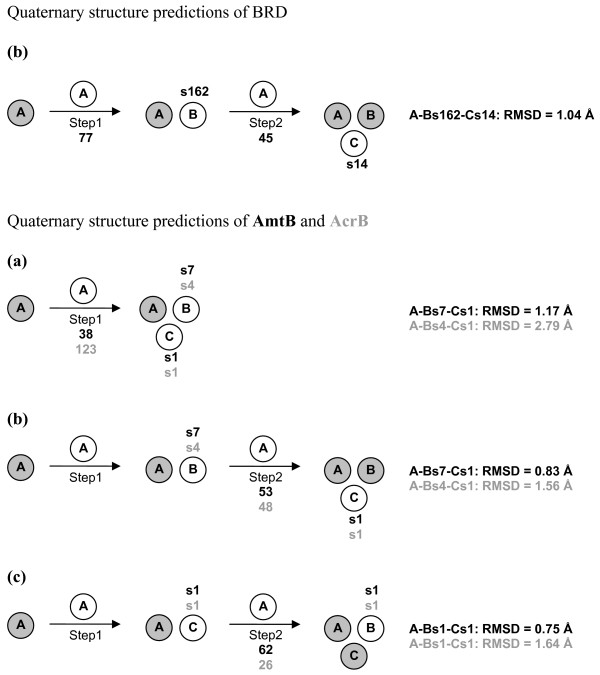
Figure 9.
Prediction path for BRD (top) and for AmtB and AcrB (bottom). The description of this figure is the same as that in Figure 6. For BRD, only one growing path has been pursued. In contrast, for quaternary structure predictions of AmtB and AcrB, the growing paths (a), (b) and (c) were probed. Black bold labels refer to AmtB, whereas gray bold labels refer to AcrB predictions.

