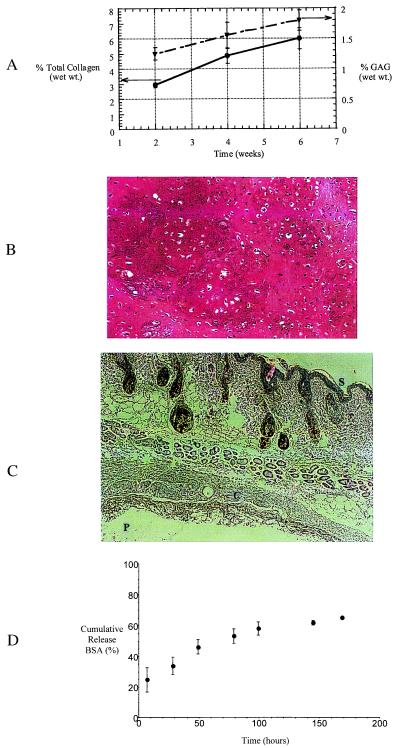
Figure 3.
(A) Total collagen and GAG contents (per construct wet weight) of chondrocytes encapsulated and implanted by transdermal photopolymerization. (B) Safranin O-stained histological section of neocartilage 6 weeks postimplantation (×200). (C) Hematoxylin/eosin-stained section of an implanted hydrogel (P, without cells), surrounded by a fibrous capsule (C), s.c. tissue and skin (S). (D) Release of BSA from PEODM (Mr 1,000) hydrogels over 200 hr.

