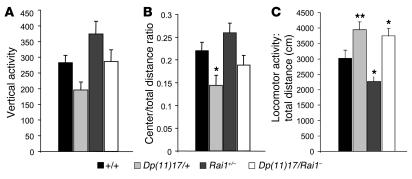
Figure 5. Correcting Rai1 gene dosage rescues behavioral deficits.
Different parameters measured in the open field are represented for each of the 4 genotypes tested. (A) Vertical activity [F(3, 73) = 4.458; P = 0.06]. (B) Center/total distance ratio [F(3, 71) = 4.893; P < 0.004]. (C) Total distance (cm) [F(3, 73) = 9.498; P < 0.001]. Black bars, wild type; light gray bars, Dp(11)17/+; dark gray bars, Rai1+/–; white bars, Dp(11)17/Rai1–. Values represent mean ± SEM. Actual values are given in Supplemental Table 3. *P < 0.05, **P < 0.01, significant differences compared with wild-type littermates.

