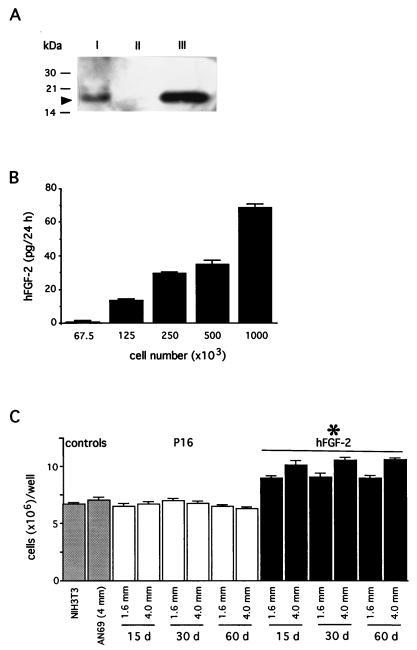
Figure 3.
Production of hFGF-2 in stably transfected fibroblasts. (A, lane I) This Western blot of crude cell extracts (105 cells/lane) indicates the 18-kDa hFGF-2 in FGF18 (arrow head). (A, lane III) Its apparent molecular mass corresponds to that of hFGF-2 (10 ng). (A, lane II) P16 cell extract. (B) Secretion of hFGF-2 by FGF18 at different cell densities. Data are expressed as mean values (pg per 24 h) ±SEM (n = 6). (C) Bioassay of hFGF-2 secretion from 1.5-mm and 4.0-mm capsules filled with either P16 or FGF18 and kept in culture for 15, 30, or 60 days. Data are expressed as mean values ± SEM. (∗, P < 0.001; n = 6.)

