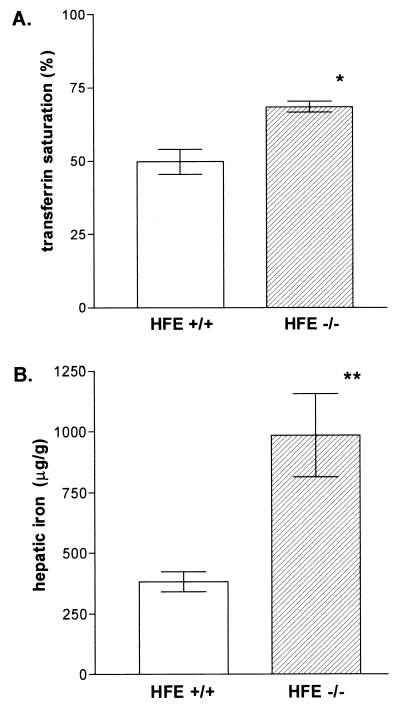
Figure 1.
Serum transferrin saturations and hepatic iron concentrations and in the HFE−/− mice and HFE+/+ littermates. At 4 weeks of age the mice were sacrificed, and blood and liver specimens were obtained. (A) Serum total iron binding capacities and iron concentrations were measured. Transferrin saturations were calculated and expressed as mean ± SEM. ∗, P < 0.001. (B) Liver nonheme iron concentrations (micrograms of iron per gram dry liver) were measured and expressed as mean ± SEM. ∗∗, P < 0.005.

