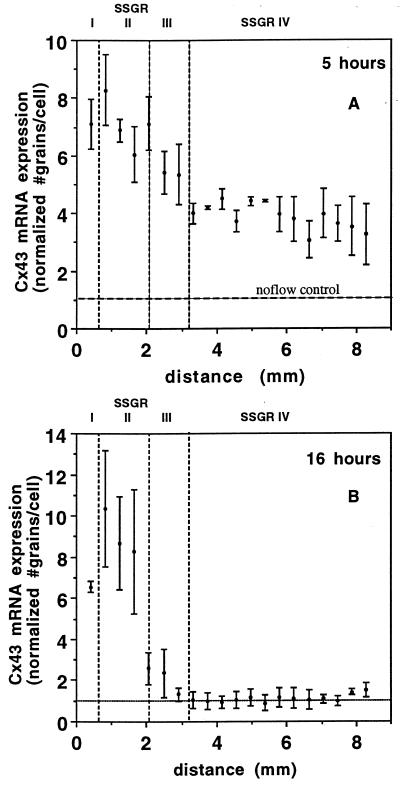
Figure 3.
Spatial distribution of Cx43 mRNA expression. (A) Endothelial monolayers exposed to disturbed flows for 5 h. (B) Endothelial monolayers exposed to disturbed flows for 16 h. Each data point represents the average number of grains per cell (normalized to the no-flow control) in three to seven high-power fields (0.21 × 0.15 mm) from three separate experiments. Bars = means ± SD. The horizontal axis, x (mm), is the distance measured from the downstream edge of the step. The vertical, dotted lines mark the boundaries of the four SSGRs. The shear stress gradient in SSGRI and II is 182–188 dynes/cm2 cm. The shear stress gradient is 22 dynes/cm2 cm in SSGRIII and negligible in SSGRIV.

