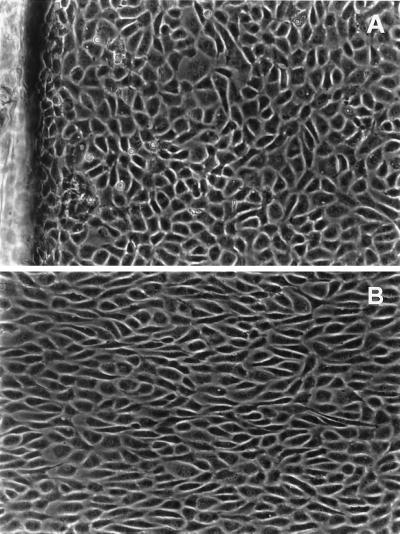
Figure 5.
Endothelial cell morphology in disturbed and undisturbed flow regions. Phase-contrast images of endothelial cells after 30-h flow. (A) Disturbed flow region SSGRI/II. The step is visible on the left edge of the photograph. Average cell aspect ratio (AR) was 2.4; average angle of orientation with flow direction (θ) was 40°. (B) Cells from the downstream recovered laminar flow region SSGRIII/IV. AR was 3.4 and θ was 15°. Flow is from left to right.

