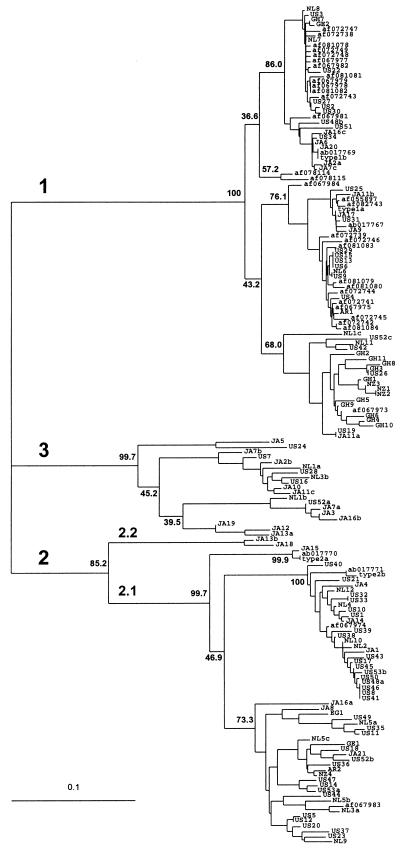
Figure 3.
Consensus phylogenetic tree (unrooted) of 260 nt (amplification primers removed) from 163 TTV isolates. Branch lengths are proportional to the genetic distance (scale shown). Isolates representing the subtypes (1a, 1b, 2a, and 2b) proposed by Okamoto et al. (2) are labeled. GenBank accession numbers are given where appropriate. Geographical designations: AR, Argentina; EG, Egypt; GE, Greece; GH, Ghana; JA, Japan; NL, The Netherlands; NZ, New Zealand; US, United States. Sequences isolated from a single individual are designated with the isolate number followed by the lower case letters a, b, or c. Bootstrap values are shown at the nodes for 1,000 resamplings of the data. Genetic groups are indicated as genotypes 1, 2, and 3 and subtypes 2.1 and 2.2.

