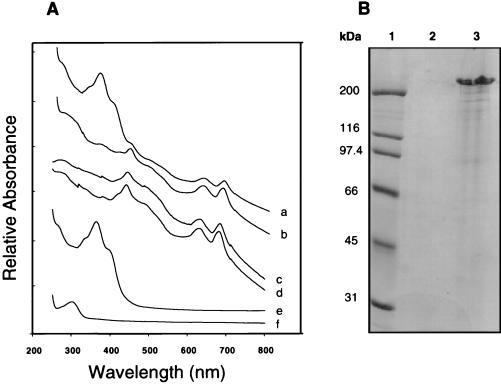
Figure 2.
(A) Spectra of wild-type (WT) and sigB cultures. Spectra (250–800 nm) were measured from 6-day-old cultures of the sigF mutant (a) and WT (b), the cell pellet of the sigF mutant (c) and WT (d), and the growth media of the sigF mutant (e) and WT (f). Spectra are offset along the ordinate and normalized to cell density as reflected by absorbance at 750 nm. (B) SDS/PAGE of polypeptides precipitated from the growth media from WT (lane 2) and sigF mutant (lane 3) cultures and stained with Coomassie blue. Molecular mass markers (in kDa) are shown in lane 1.

