Figure 1.
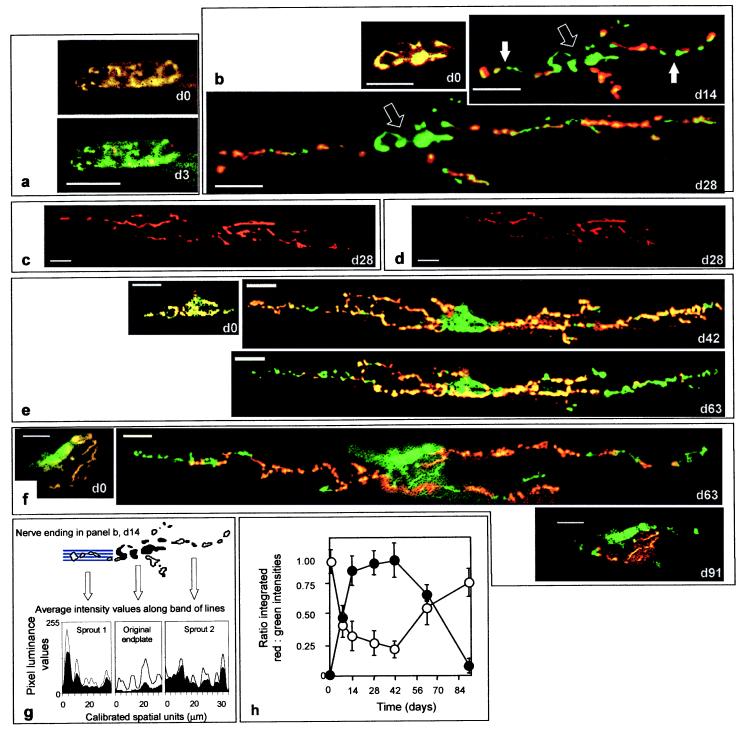
Repeated in vivo visualization of FM1-43 uptake into nerve endings on the mouse sternomastoid muscle (taken before and after BoTx/A-poisoning) indicated a transient switch in the locus of stimulation-dependent vesicular uptake and release between the nerve terminals and their toxin-induced sprouts. (a, b, e, and f) At d0, before BoTx/A injection, FM1-43 (red) uptake was seen in the nerve terminals also stained with 4-di-2-ASP (green), and their overlap appears as yellow. (a, d3) Imaging at d3 indicated a dramatic diminution in depolarization-induced FM1-43 uptake. Although staining of the original terminals (b, open arrows) remained suppressed, FM1-43 endocytosis became apparent in the sprouts (b, closed arrows), after their appearance and extension (b; d14 and d28). In a separate experiment, FM1-43-loaded sprouts (c) at d28 were destained visibly on depolarization (d), establishing that they also can mediate stimulated exocytosis. On further extension (e; up to d42) the sprouts continued to be labeled with FM1-43, but imaging at d63 and thereafter indicated that uptake recovered in the parent terminals, while such staining in the sprouts began to decline preceding their retraction (e and f; d63). (f; d91) By d91, FM1-43 uptake at the original endplate closely resembled that recorded immediately before injection. Luminance levels were quantified for both 4-di-2-ASP and FM1-43 staining in the original endplates and sprouts, as illustrated, for example, at d14 (b); filled arrows in that image pinpoint two of the four sprouts present. (g) The average pixel-intensity values calculated from bands of lines (depicted schematically for sprout 1) are plotted for red (filled curve) and green (open curve) channels for these two processes and the original terminals. (h) The integrated red and green intensity values for all sprouts (closed circles) and their parent terminals (open circles) obtained in this manner were averaged ±SEM (from 11–16 endplates in three or four mice at each time point), and their ratios were plotted for the entire time course. a, b, e and f show repeated visualizations of the same endplates with each series having been obtained from different animals. (Bars = 20 μm.)

