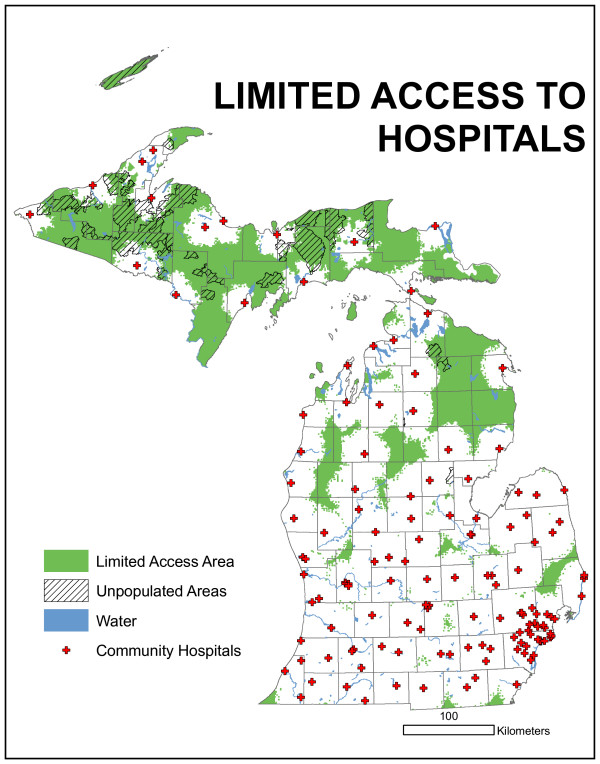
Figure 7.
Results of access-based model using a 25% urban road speed limit reduction. The areas under-served essentially remain with slightly more total area now included. Careful comparison of Figure 6 with 7 permits the identification of new areas. However, this reduction in urban speed limits does not dramatically alter the configuration of the under-served areas.

