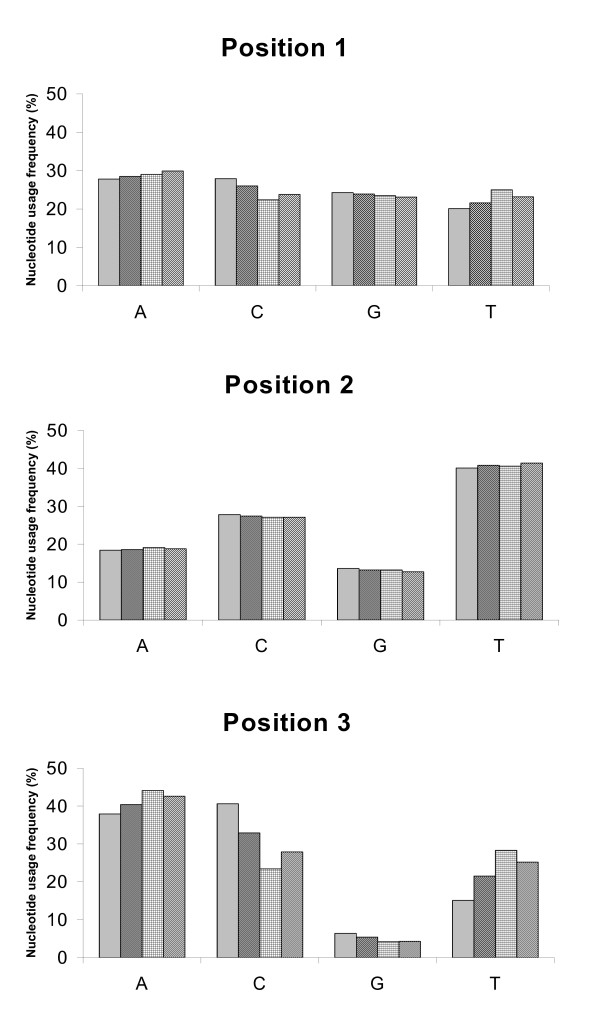
Figure 3.

Nucleotide usage frequency of three osteoglossids compared to that of the bichir. Frequency of nucleotide usage according to codon position for all protein-coding genes. Order of bars from the left: Asian arowana ( ), silver arowana (
 ), butterfly fish (
 ) and bichir (
 ).
).
