
Figure 4.
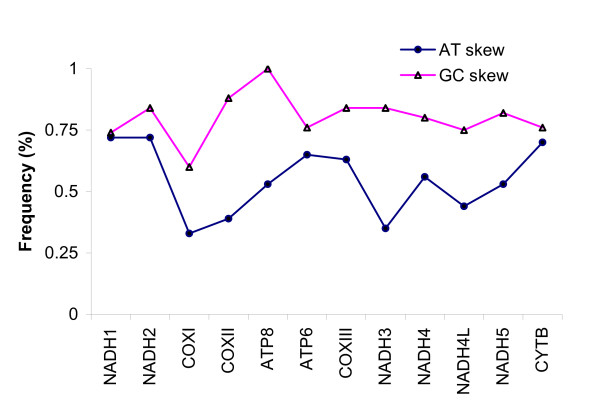
The GC and AT skew for mitochondrial protein-coding genes in Asian arowana mtDNA. Graphical representation of absolute values is shown. Genes are ordered according to their position in the mitochondrial genome.
Official websites use .gov
A
.gov website belongs to an official
government organization in the United States.
Secure .gov websites use HTTPS
A lock (
) or https:// means you've safely
connected to the .gov website. Share sensitive
information only on official, secure websites.
The GC and AT skew for mitochondrial protein-coding genes in Asian arowana mtDNA. Graphical representation of absolute values is shown. Genes are ordered according to their position in the mitochondrial genome.