
Figure 2.
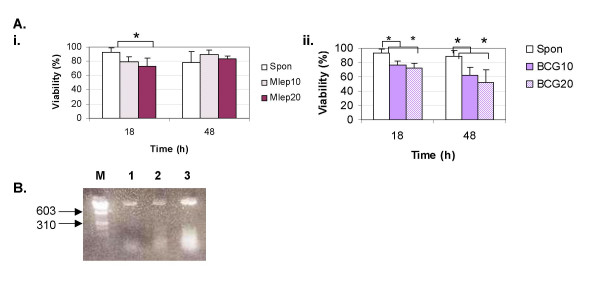
M. leprae induces a lower rate of cell death as compared with BCG. THP-1 cells were infected with M. leprae and BCG as described in Fig. 1. A. Cellular viability was assessed after fluorescent staining at 18 and 48 h post-infection. Graphs show the results from 5 independent experiments with SD shown as 'y' error bar. '*' denotes significant differences (P < 0.05). (i) M. leprae, (ii) BCG. B. Agarose gel electrophoresis of internucleosomal DNA fragmentation in THP-1 cells shows spontaneous (lane 1), or BCG-induced apoptosis at MOI-10 (lane 2) and MOI-20 (lane 3) after 18 h of culture. The molecular markers are indicated to the left (lane M).