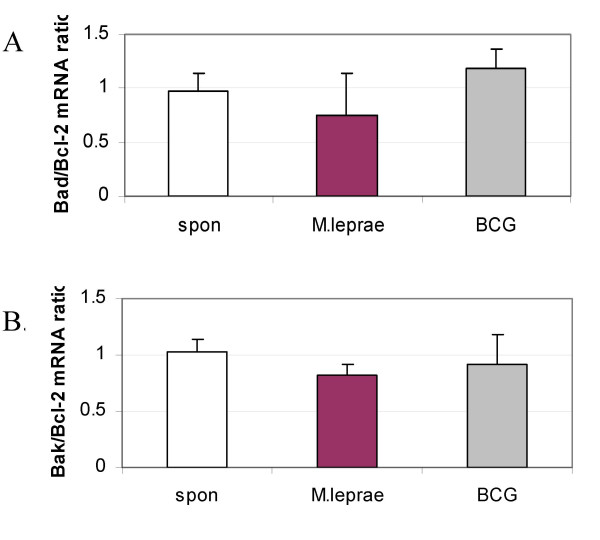
Figure 5.

Differential downregulation of Bad/Bcl-2 and Bak/Bcl-2 mRNA by M. leprae as compared with BCG. Gene expression was determined in cells infected with either M. leprae or BCG at 18 h post-infection. mRNA expression was quantified using densitometry and graphs illustrate the mean pro-/anti-apoptotic gene ratios of 3 independent experiments. A. Bad/Bcl-2 and B. Bak/Bcl-2 mRNA expression.
