
Figure 1.
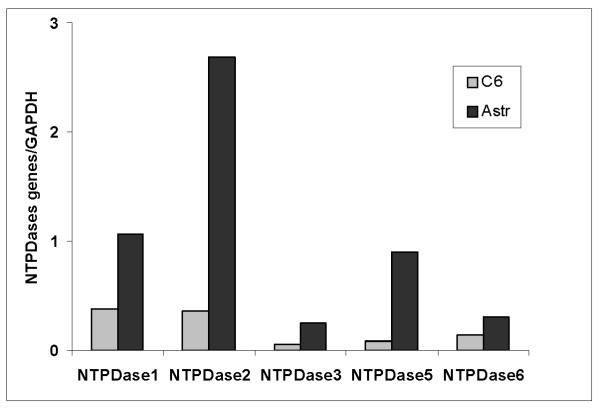
Comparison of NTPDase family expression in rat cortical astrocytes and rat C6 gliomas by quantitative real-time RT-PCR analysis. The expression of NTPDase members in astrocytes and C6 gliomas was quantitatively analyzed by real-time PCR as described in material and methods. C6: rat glioma cell line. Astr: cortical rat astrocytes. The results are presented as a ratio of cDNA enzymes/GAPDH.