
Figure 2.
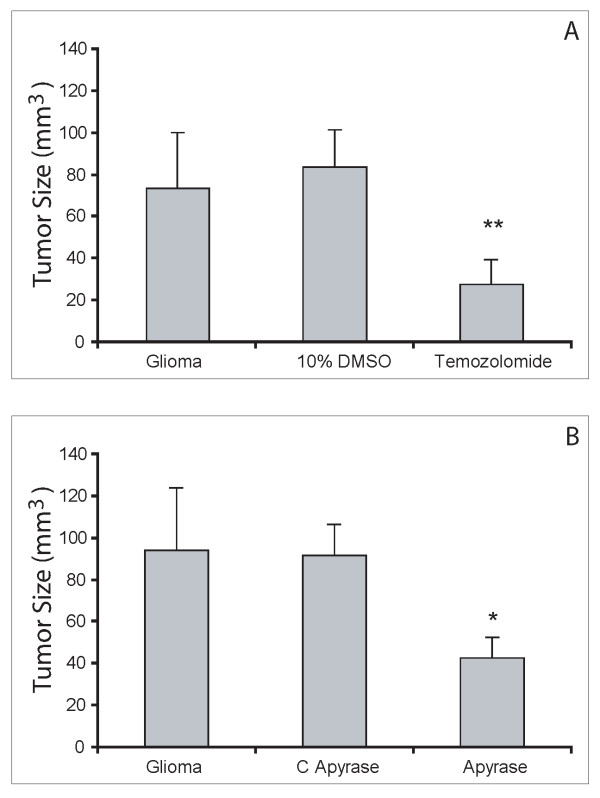
Tumor size of implanted gliomas. Tumor size was measured 20 d after implantation of C6 cells in the different groups. (A) Rats were treated with 10% DMSO (vehicle control) or temozolomide in 10% DMSO (n = 5). (B) C6 cells were co-injected with: denaturated apyrase (C apyrase) or 2 U of apyrase (apyrase group) (n = 6). Data are means ± SEM. **p < 0.01; *p < 0.05 for comparison versus control, as determined by ANOVA, followed by Tukey-Krammer test.