
Figure 1.
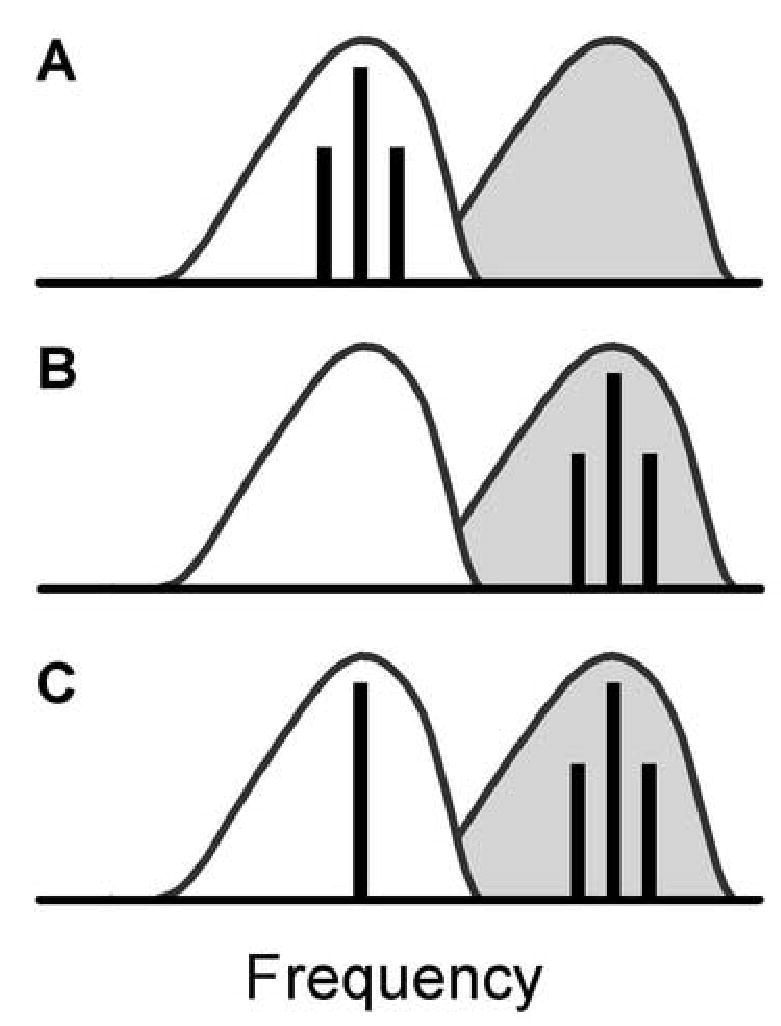
Schematic representation of SAMCF (A), SAMI (B), and SAMI+TONECF (C) stimulus conditions. The unshaded area indicates the excitatory RA of a hypothetical neuron, while the shaded area to the right of the excitatory RA indicates the inhibitory RA. Vertical lines indicate the placement of pure tones (one line) or SAM tones (three lines) relative to the RAs.