
Figure 9.
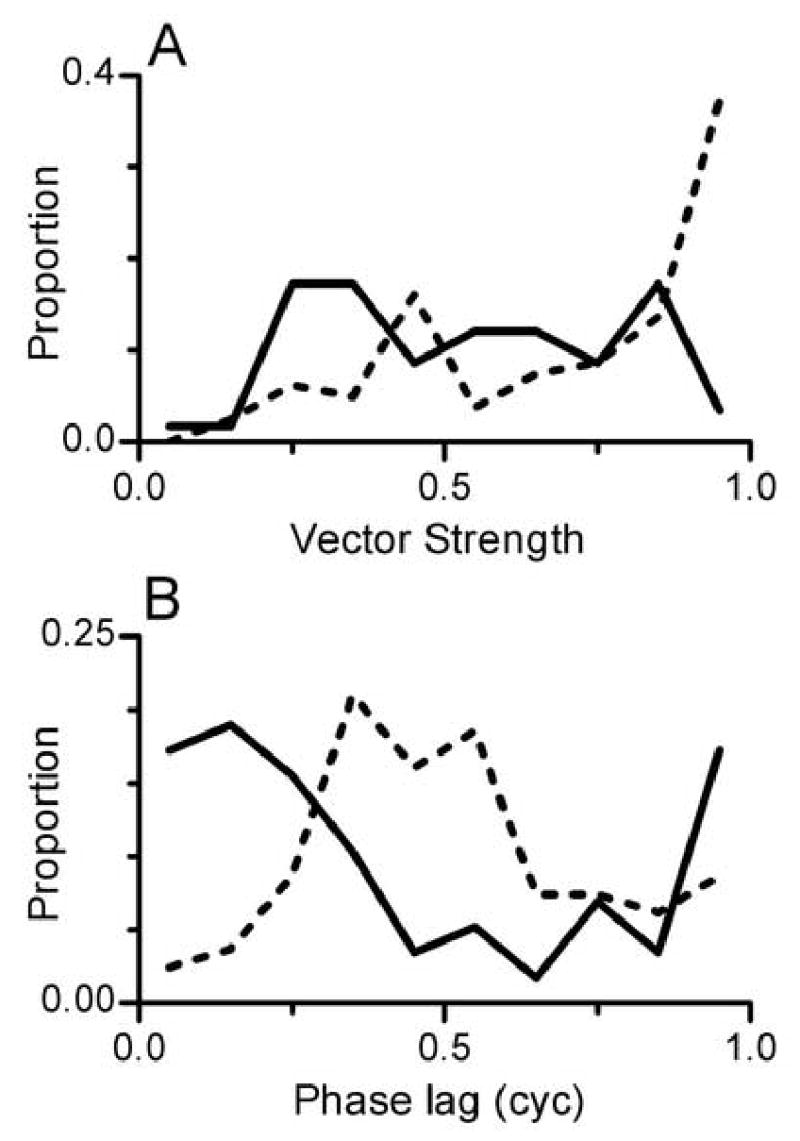
A. Distribution of VS in responses to tones modulated with Fm = 16 Hz. Dashed line: distribution of VS in response to SAMCF tones, from 81 cycle histograms. Solid line: distribution of VS in response to paired SAMI+TONECF stimuli, from 58 cycle histograms.
B. Distribution of phase lags in responses to tones modulated with Fm = 16 Hz. A phase lag of 0 or 1 cyc indicates a response at an amplitude minimum of the modulated envelope, and a phase lag of 0.5 cyc indicates a response at an amplitude maximum. Dashed line: distribution of phase lags in response to SAMCF tones, from the same dataset shown in Panel A. Solid line: distribution of phase lags in response to paired SAMI+TONECF stimuli, from the same dataset shown in Panel A.