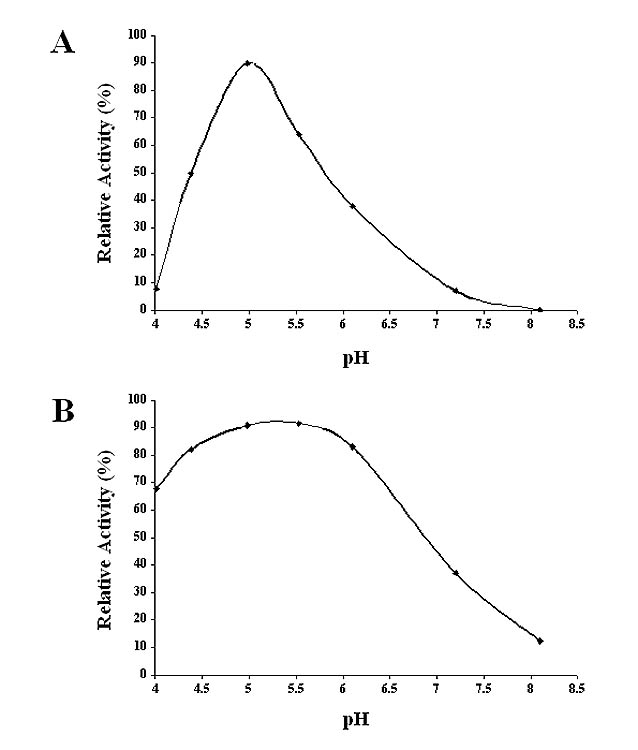
Fig. 10.

pH optima for SfGlcNAcase activities towards GnGn. Microsomal fractions containing (A) 10 ug of total protein from AcGlcNAcase-1 or (B) 1.5 ug of total protein from AcGlcNAcase-3-infected Sf9 cells were incubated for about 16 h or 4 h, respectively, with GnGn at pH values ranging from 4.0–8.0, and then the reaction products were recovered and analyzed by reverse-phase HPLC, as described in Materials and Methods. The plots show the relative amounts of products observed at each pH, as a percentage of the sum of the areas under all product peaks divided by the sum of the areas under all observed substrate and product peaks.
