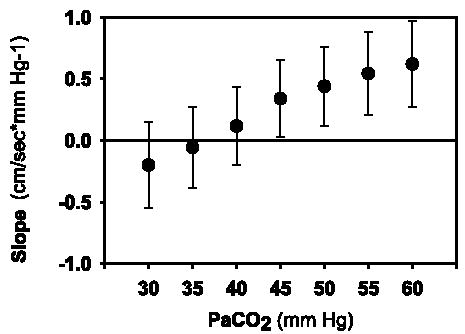
Figure 3.

Estimated mean slopes and 95% confidence intervals of the autoregulatory plateau for Paco2 values 30, 35, 40, 45, 50, 55, and 60 mm Hg for 43 VLBW infants. Bars indicate 95% confidence intervals for the mean slopes of the autoregulatory plateaus for Paco2 30 (n = 82), 35 (n = 94), 40 (n = 100), 45 (n = 103), 50 (n = 100), 55 (n = 90), and 60 mm Hg (n = 83). The horizontal line at slope 0 indicates intact autoregulation. The estimated means of the slope of the autoregulatory plateau (cm/s * mm Hg−1) increased as Paco2 increased (p = 0.004).
