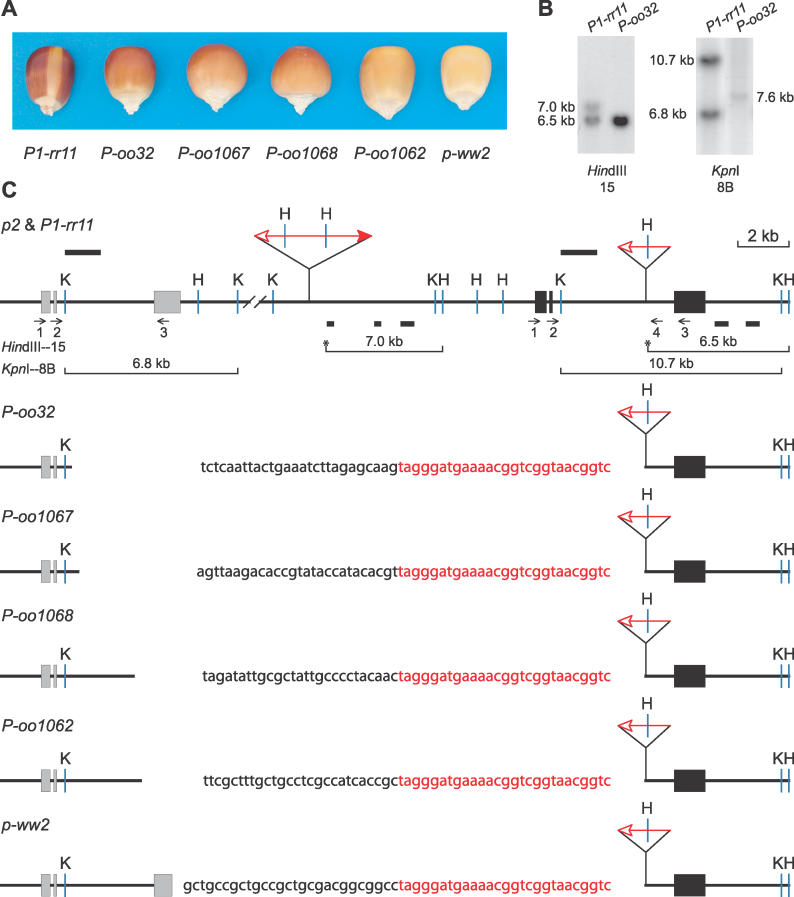
Figure 1. Phenotypes and Gene Structures of P-oo Alleles.
(A) The kernel pericarp pigmentation phenotypes specified by the indicated alleles.
(B) Genomic Southern blot. Genomic DNA from plants homozygous for the indicated alleles was cut with KpnI and HindIII, and hybridized with probes 15 or 8B from the p1 gene. Lanes marked P-oo32 contain approximately twice as much DNA as lanes marked P1-rr11; this DNA overloading enables the detection of the 7.6-kb band in the KpnI 8B blot, but also results in the intense 6.5-kb band in the HindIII 15 blot.
(C) Restriction map. The solid and gray boxes are exons 1, 2, and 3 (left to right) of p1 and p2, respectively. Red triangles indicate Ac or fAc insertions, and the open and solid arrowheads indicate the 3′ and 5′ ends, respectively, of Ac/fAc. Sequences hybridizing with Southern blot probes are indicated by the solid bars above (probe 8B) and below (probe 15) the map. The short horizontal arrows indicate the orientations and approximate position of PCR primers. Primers are identified by numbers below the arrows. The sequence of the junction of each fusion allele is shown here; the black letters indicate p2 sequence, while the red letters indicate fAc sequence. K, KpnI; H, HindIII. Lines below the map indicate the restriction fragments produced by digestion with KpnI or HindIII and hybridizing with the indicated probe; asterisks indicate HindIII restriction sites located within Ac or fAc sequences.

