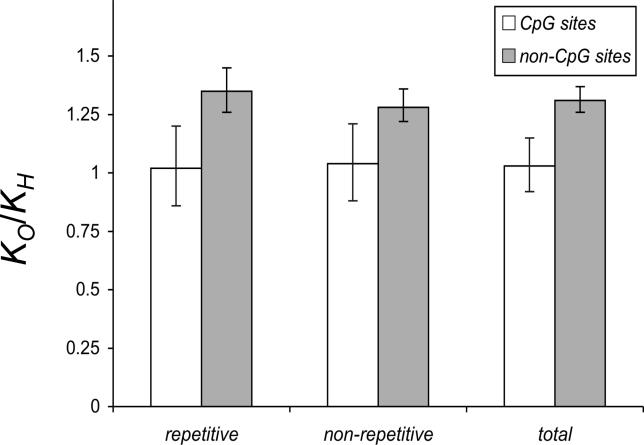
Figure 3. Contrasting Molecular Clocks of Transitions at CpG Sites versus Those at Non-CpG Sites.
The y-axis shows the rate difference in the baboon-macaque pair to that in the human-chimpanzee pair. The Old World monkey pair has accumulated significantly more transitions in non-CpG sites, as expected by the generation time effect. In contrast, transitions at CpG sites, which are primarily of methylation origin, show no difference between the two pairs. Data are shown for all sites, repetitive sites (as identified from the RepeatMasker program [57]), and nonrepetitive sites (after removing repetitive sites). Confidence intervals are generated by bootstrapping 10,000 times.

