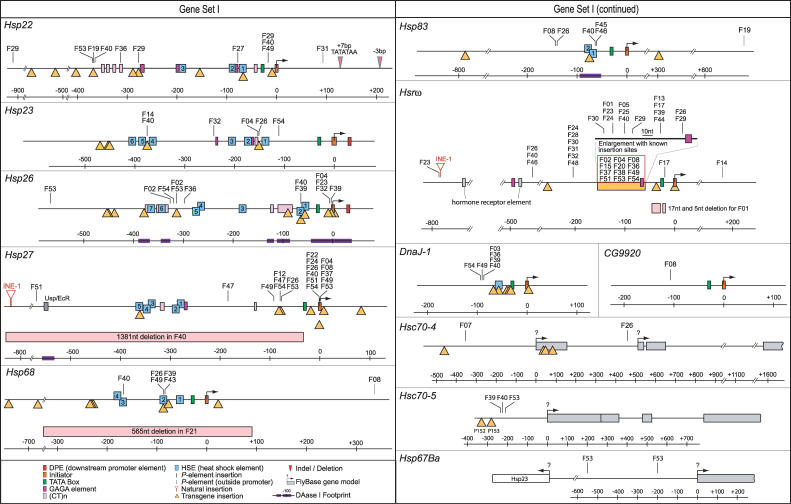
Figure 4. Locations of P Elements Integrating into the Proximal Promoters of Heat-Shock Genes Other than Hsp70 (Gene Set I).
Data are plotted as in Figure 2 except as follows: F-numbers in columns refer to natural populations with transposons integrating at identical sites. Primer sets used in the screens amplified regions 3′ to transcription start site of different length; P elements discovered upstream of the initiator are plotted (pale), but not included in comparative analyses (i.e., in Hsp22 in population F31, Hsp68 in F05, and in Hsrω in F14). In Hsrω, numerous P elements were discovered in one region (box); a randomly chosen subset of these were localized (by sequencing) within that region (see enlargement). Several putative deletions were also discovered, and are plotted. For population codes see Figure 1. Table S1 provides additional information about Gene Set I and relevant sources for the organization of promoter regions.

