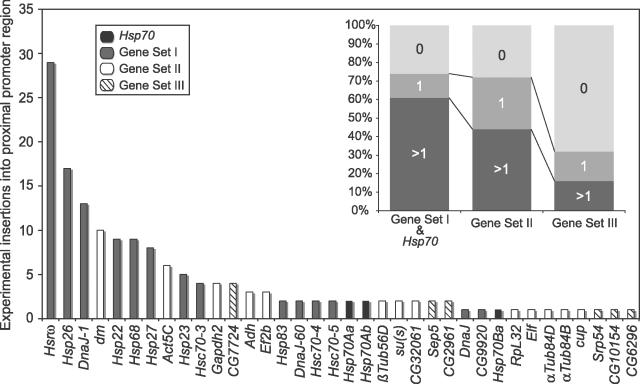
Figure 6. Frequencies of Experimental P Element Insertions Reported by FlyBase Database into the Proximal Promoter Regions of Each of the Genes Screened in Natural Populations in the Present Study.
Data are plotted as in Figure 3. Note that insertions in the different Hsp70 copies are not combined as in Figure 3. The FlyBase database (http://flybase.bio.indiana.edu/transposons/) terms all tallied P element insertions as “transgene insertions.”

