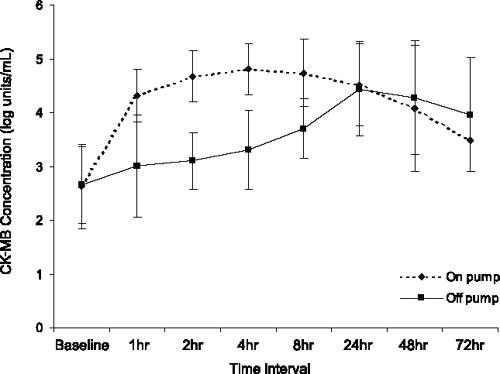
Fig. 2 Time course of CK-MB concentrations, broken down by surgical procedure. The 2 curves differ significantly (P <0.001). The CK-MB concentration was significantly higher in the on-pump group than in the off-pump group at 1, 2, 4, and 8 hours (P <0.001). CK-MB concentrations were comparable at 24, 48, and 72 hours.
Values are expressed as mean ± standard deviation.
CK-MB = creatine kinase-MB
