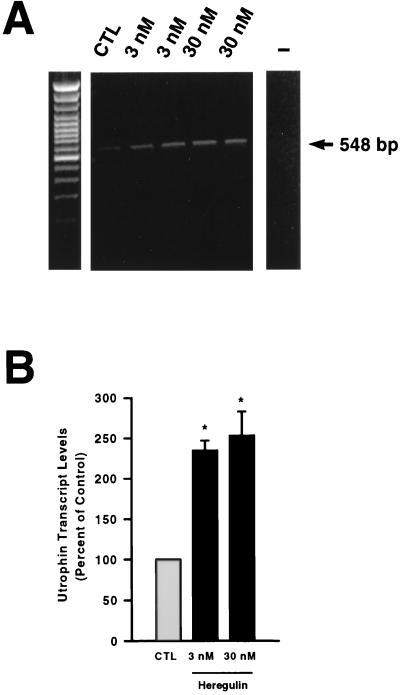
Figure 1.
(A) A representative example of an ethidium bromide-stained gel of utrophin PCR products (548 bp) obtained from nontreated (control; CTL) versus heregulin-treated (3 or 30 nM) mouse myotubes. Note the increase in utrophin mRNA levels after heregulin treatment. The negative control lane is marked with a minus sign. The left panel is the 100-bp marker (GIBCO/BRL). (B) Quantitative analysis of utrophin mRNA levels in control and heregulin-treated myotubes. Utrophin transcript levels are expressed as a percent of control. Asterisks denote significant differences from control (CTL) levels (Student’s t test, P < 0.05).

