
Figure 3.
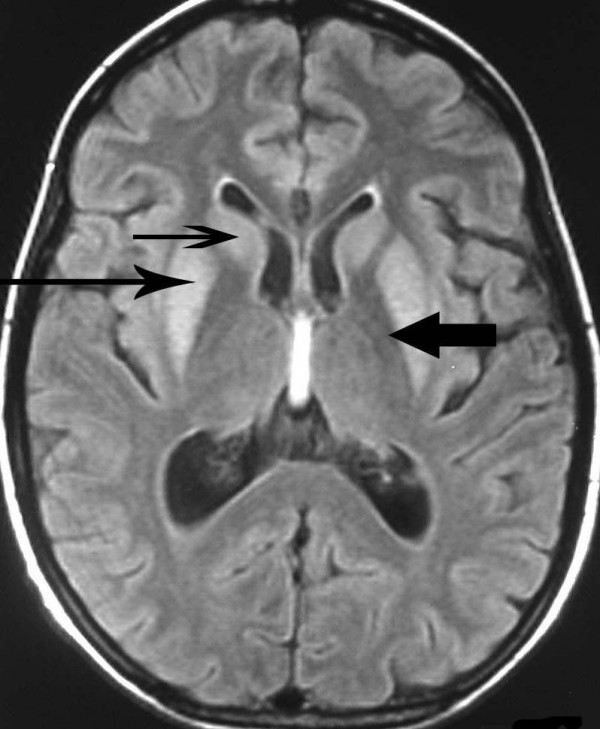
T2 weighted FLAIR images of magnetic resonance scan showing bilaterally symmetrical hyperintensities in Caudate nucleus (small, thin arrow), Putamen (long arrow), with sparing of Globus Pallidus (broad arrow), suggestive of Extrapontine myelinolysis.