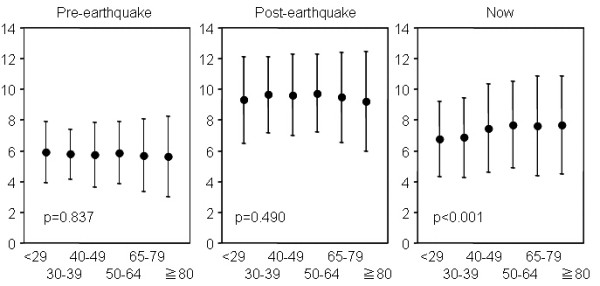
Figure 2.

Difference in C-GHQ scores by age. C-GHQ scores before the earthquake (pre-earthquake), at the most stressful time after the earthquake (post-earthquake) and five months after the earthquake (now) are shown as mean and standard deviation values. In each graph, plots from left to right correspond to the six age groups shown in Table 1. The effect of age of subjects on the GHQ-12 scores was analyzed by ANOVA. The p value in each test is shown in the plot.
