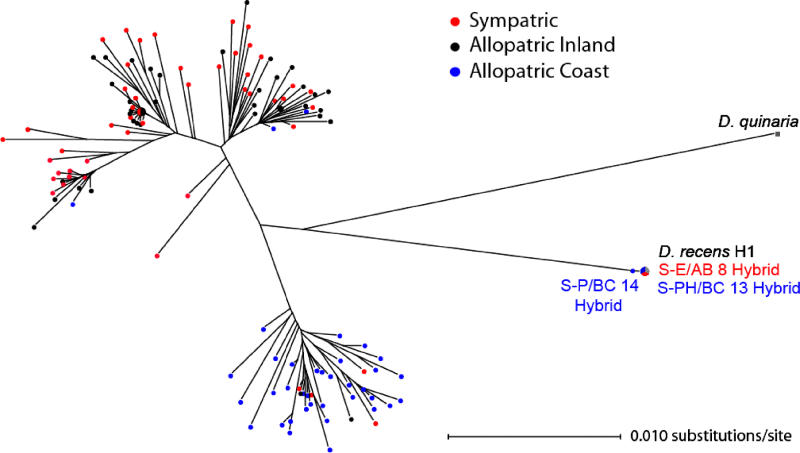
Figure 6. Minimum-Spanning Tree for D. subquinaria COI .
Red dots are samples collected from the inland-sympatric populations, black dots represent inland-allopatric samples, and blue represent coastal-allopatric populations. The sizes of the circles indicate number of samples with each haplotype. The individuals identified as hybrids carry mtDNA haplotypes typical of D. recens but nuclear genes from D. subquinaria. Note the difference in scale between this figure and that for D. recens (Figure 7).

