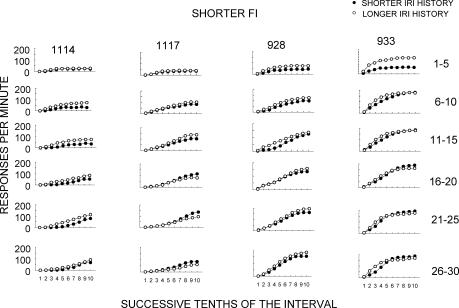
Fig 3. Response rates during successive tenths of the shorter FI for each subject.
From top to bottom, averaged values for Sessions 1 through 5, 6 through 10, 11 through 15, 16 through 20, 21 through 25, and 26 through 30 of the history-testing condition, respectively, are shown. Filled circles represent responding under the stimuli previously correlated with a tandem VI DRL schedule that produced shorter IRIs, whereas open circles represent responding under the stimuli previously correlated with a tandem VI DRL schedule which produced longer IRIs.

