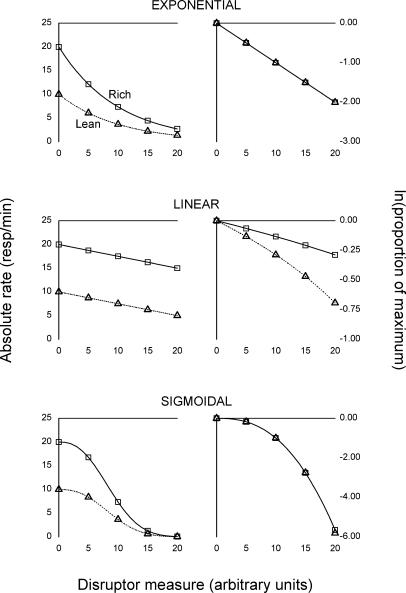
Fig 1. Three hypothetical cases of exponential (top row), linear (middle row), and sigmoidal (bottom row) dynamics of responding under disruption.
In each case, absolute response rate in the rich component (squares and solid lines) is supposed to be higher in baseline than absolute response rate in the lean component (triangles and dotted lines). For each model, the panel in the left column shows raw response rates, whereas the panel in the right column shows normalized and log-transformed response rates. The units for disruptor amount are arbitrary. See text for the equations and parameters used to generate the curves.

