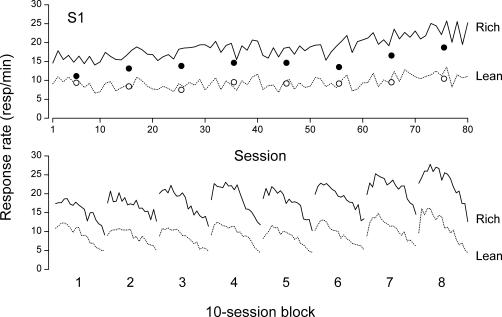
Fig 2. Upper panel: Daily response rates on the rich schedule (solid line) and on the lean schedule (dotted line) for rat S1.
The filled and unfilled circles show response rates in the discrimination probes for the rich and lean schedules, respectively, averaged by blocks of 10 sessions. Lower panel: Within-session response profiles on the rich schedule (solid lines) and on the lean schedule (dotted lines) for S1. Each profile comprises 18 data points and was obtained by averaging response rates over 10 successive sessions.

