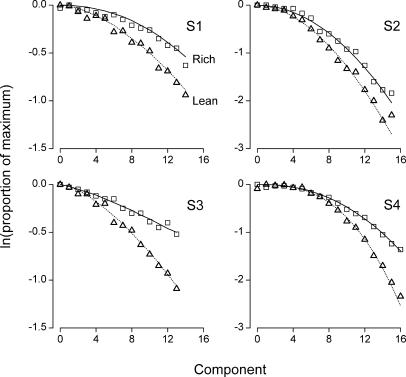
Fig 5. Within-session, decreasing resistance functions on the rich schedule (squares) and on the lean schedule (triangles) for each rat.
The data correspond to the late-session curves of Figure 3, normalized and log-transformed. Solid and dotted lines indicate the normalized, log-transformed, best-fitting predictions of Equation 6 for the rich and lean schedules, respectively. In each panel and as in Figure 4, the zero of the horizontal axis coincides with the earlier of the two response peaks. Notice the different vertical scales for each rat.

