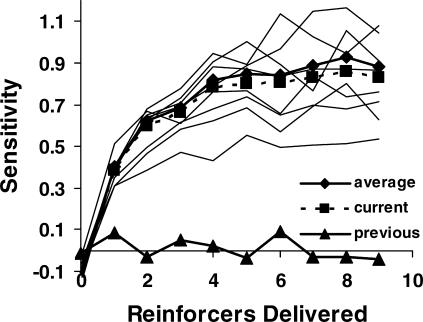
Fig 2. Sensitivity to reinforcer ratio (s in Equation 1) as a function of the number of reinforcers delivered in a component, calculated using arranged reinforcer ratios.
The light lines represent data for the individual rats, and the heavy solid line with diamonds indicates the group average. The heavy broken line with squares and the heavy solid line with triangles show the slopes from multiple regression analysis using current reinforcer ratio and previous behavior ratio as the predictor variables, respectively. Points plotted at zero on the x-axis indicate performance before any reinforcer was delivered.

