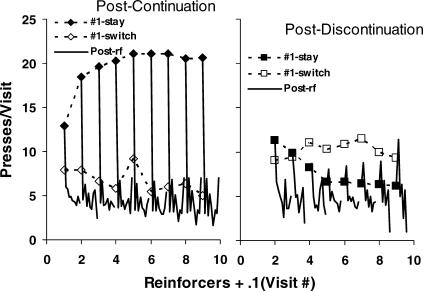
Fig 9. Visit length (presses per visit) following a series of continuing reinforcers (left graph) or following a series of continuing reinforcers ending with a discontinuation (right graph) for the first nine reinforcers in a component (group data).
Filled symbols show the first postreinforcer visit to the just-reinforced lever (#1 stay). Unfilled symbols show the first postreinforcer visit to the not-just-reinforced lever (#1 switch). The solid lines without symbols represent the subsequent nine postreinforcer visits (i.e., postchangeover visits) in order, plotted in tenths along the x-axis. Sample size was allowed to vary down to one visit.

