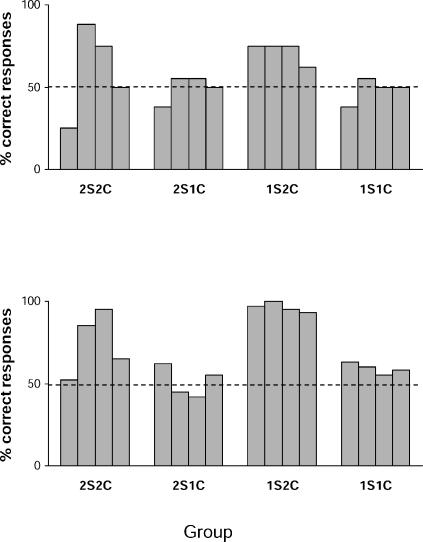
Fig 6. Top: Percentage of correct responses for each pigeon from each experimental group in the symmetry test, after the corresponding conditional discrimination training.
Bottom: Percentage of correct responses given by these pigeons in the first session of the conditional discrimination, when they were faced for the first time (except Group 2S2C) with two samples and two comparisons (second conditional discrimination).

