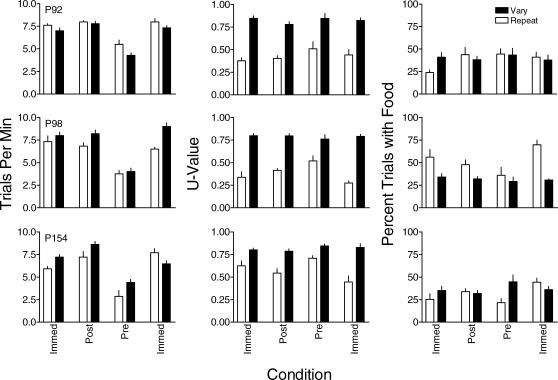
Fig 7. The effect of pre- and postreinforcer delays on trials/min (left column), U-value (center column), and percentage of trials with food (right column) for each pigeon in Experiment 4.
Filled and unfilled bars represent data from the vary and repeat components, respectively. Error bars indicate one standard deviation above the mean.

