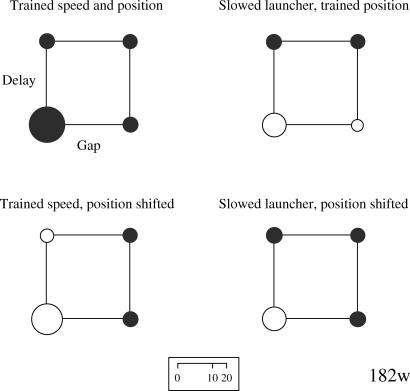
Fig 2. Bubble charts for Pigeon 182w's rate of pecking to each of the training and testing stimuli.
The bubbles are arranged along the two dimensions of spatial gap (no gap at the left, a gap at the right) and temporal delay (none at the bottom, a delay at the top). The direct causal animation was the S+. The dark circles designate the training stimuli and are constant across all four charts. The white circles designate those animations used in testing in which the red square was slowed, had its initial position shifted, or both. Circle area corresponds to the peck rate, and thus the peck rate scale (at the bottom) is not linear as a function of circle diameter. See text for additional details.

