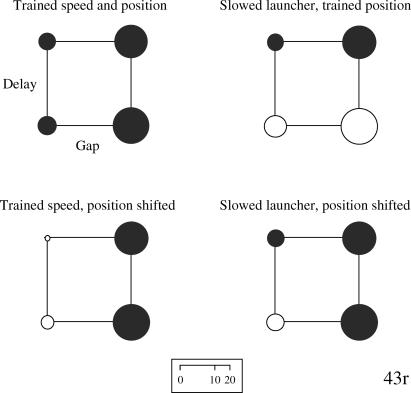
Fig 5. Bubble charts for Pigeon 43r's rate of pecking to each of the training and testing stimuli.
The bubbles are arranged along the two dimensions of spatial gap (no gap at the left, a gap at the right) and temporal delay (none at the bottom, a delay at the top). The distal & delayed animation was the S+. See text for additional details.

