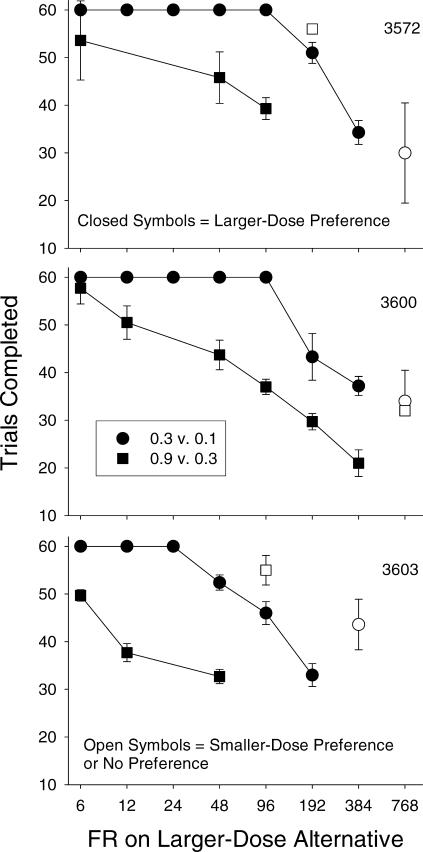
Fig 4. Phase 2.
Mean number of trials completed as a function of the response requirement programmed on the larger-dose alternative. Error bars represent standard deviations. Circles represent comparisons employing 0.3 and 0.1 µg/kg/inj; squares represent comparisons employing 0.9 and 0.3 µg/kg/inj. Open symbols represent comparisons in which the larger-dose alternative was not preferred.

