
Figure 3.
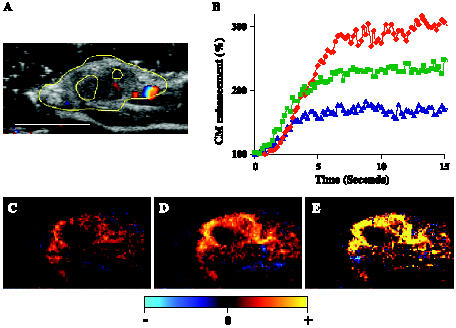
HGF/SF effect on tumor enhancement: time dependency and mapping. A mouse bearing a DA3 mammary adenocarcinoma tumor was injected intravenously with saline, followed by HGF/SF. CM ultrasound imaging was performed before HGF/SF treatment and 20 minutes after HGF/SF treatment. (A) The tumor was imaged using color Doppler ultrasound. For further calculation and quantification, the tumor was outlined (yellow mark) to specify the ROI based on structural criteria. Size bar, 1 cm. (B) A graph representing alterations of CM enhancement on HGF/SF treatment for marked ROI (panel A, yellow). CM imaging was performed before (blue curve), 20 minutes after (red curve), and 35 minutes after (green curve) HGF/SF treatment. Each curve demonstrates the average tumor enhancement after CM injection, calculated for 15 seconds (for each frame; 20 frames/sec). To normalize the signal, the background intensity was calculated as 100%. Percent SI increased by approximately two-fold and peaked 20 minutes after HGF/SF injection. (C–E) Mapping HGF/SF effects on tumor enhancement. CM ultrasound SI color-coded maps were generated (C) before HGF/SF injection and (D) 20 minutes after HGF/SF injection. Brighter red and yellow colors represent higher SI (D versus C). The HGF/SF effect was mapped as the difference in SI before and after HGF/SF injection (E), where bright yellow represents a significant increase in average SI on HGF/SF treatment.