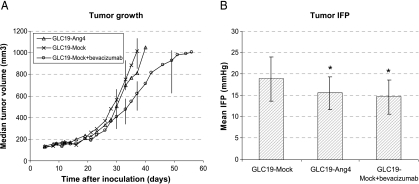
Figure 5.
GLC19-transfected cells grown as subcutaneous tumors on mice. (A) Each curve represents a median value of 10 tumors in each group. Transfection of GLC19 cells with Ang-4 did not affect tumor growth. We found no difference in growth between GLC19-Ang-4 and GLC19-mock tumors. Bevacizumab treatment significantly slowed tumor growth. Bars represent interquartile ranges. (B) IFP of subcutaneous tumors. All IFP recordings were carried out at tumor sizes of 600 to 1000 mm3. Each column represents a mean IFP of 12 to 17 tumors in each group. Data are expressed as mean ± SD.

